
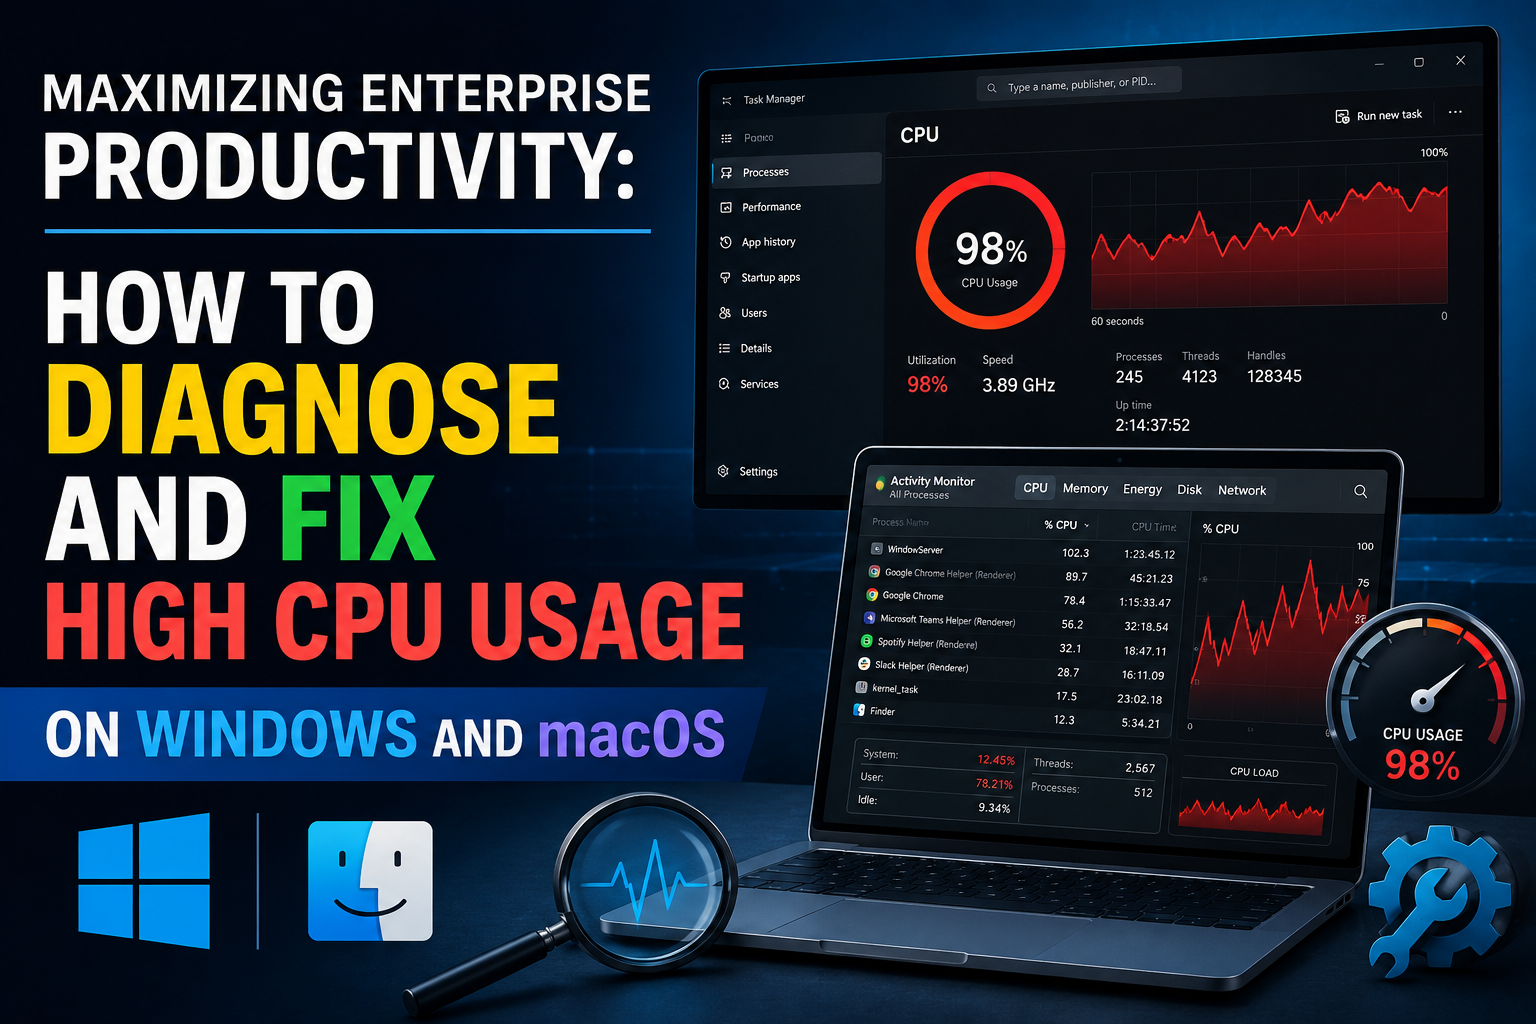
Maximizing Enterprise Productivity: How to Diagnose and Fix High CPU Usage on Windows and macOS
In a high-stakes corporate environment, time is the ultimate currency. Yet, one of the most common disrupters of executive workflow isn’t a scheduling conflict or a delayed flight—it is a sluggish operating system. When your laptop fans spin at maximum velocity and applications freeze mid-presentation, you are likely dealing with high Central Processing Unit (CPU) usage.
When your CPU hits peak capacity, it creates an operational bottleneck that directly impacts billable hours and decision-making efficiency. This comprehensive, SEO-optimized guide provides a structured framework for white-collar professionals to diagnose and remediate high CPU usage across both Windows and macOS platforms.
1. The Operational Impact of CPU Bottlenecks
The CPU is the brain of your workstation. It orchestrates every command, from rendering complex financial models to encoding video streams. When background processes or rogue applications monopolize these processing cycles, the system experiences latency.
For business professionals, this operational friction manifests as:
- Micro-stutters during screen-sharing presentations.
- Delayed responsiveness in enterprise SaaS platforms.
- Rapid battery depletion and thermal throttling.
Recognizing the root cause of these symptoms is the first step toward reclaiming digital efficiency.
2. Windows Environment: Triage and Remediation
Windows environments are highly versatile, but the sheer diversity of third-party enterprise software can occasionally lead to resource conflicts.
Step 1: Accessing the Task Manager
To diagnose the bottleneck, press Ctrl + Shift + Esc to launch the Task Manager. Navigate to the Processes tab and click on the CPU column header to sort active processes by resource consumption in descending order.
Step 2: Identifying the Culprits
In a corporate Windows setup, high CPU usage typically stems from three primary categories:
- Enterprise Browsers (Chrome/Edge): Multiple active tabs running heavy scripts or web-based extensions can easily consume substantial processing power.
- WMI Provider Host (
WmiPrvSE.exe): This built-in Windows service allows applications to request information about the system. If it continuously spikes above 20%, a background corporate application is likely querying the system defectively. - Windows Update (
tiworker.exe): Background update installations frequently consume significant resources during standard working hours.
Step 3: Implementing the Fix
- End Rogue Processes: Select the non-responsive, high-consumption application and click End Task.
- Manage Startup Applications: Switch to the Startup apps tab in Task Manager and disable non-essential software (e.g., personal cloud drives, messaging apps) from launching automatically upon boot.
- Restart the WMI Service: If
WmiPrvSE.exeremains elevated, press Win + R, typeservices.msc, locate Windows Management Instrumentation, right-click, and select Restart.
3. macOS Environment: Diagnostics for Power Users
Apple’s silicon (M-series chips) offers exceptional architecture, but poorly optimized software or legacy background daemons can still saturate system threads.
Step 1: Launching Activity Monitor
Press Cmd + Space to open Spotlight, type Activity Monitor, and press Enter. Ensure you are on the CPU tab, and click the % CPU column to isolate the processes demanding the most computational power.
Step 2: Isolating System vs. User Processes
On macOS, look out for these specific high-CPU triggers:
kernel_task: This is a protective system process. If your Mac begins to overheat,kernel_taskintentionally occupies CPU cycles to prevent other apps from generating heat, forcing the hardware to cool down.mdsormdworker(Spotlight Indexing): Following a major macOS update or large file transfers, Spotlight indexes your drive, causing a temporary but severe spike in usage.WindowServer: This process manages the visual interface. If you are driving multiple external 4K monitors or running complex window arrangements, this metric will rise.
Step 3: Implementing the Fix
- Force Quit Applications: Highlight the misbehaving process and click the “X” button in the top-left corner of the Activity Monitor window to terminate it.
- Mitigate Thermal Throttling: If
kernel_taskis high, ensure your laptop vents are unobstructed. If you are charging via a USB-C port on the left side, switch the charger to the right side; historically, left-side charging under heavy load can trigger localized thermal sensors on certain MacBook models. - Audit Login Items: Navigate to System Settings > General > Login Items and remove background applications that do not serve an immediate business purpose.
4. Institutional Prevention: Maintaining Peak Performance
To minimize future operational downtime, business professionals should adopt a proactive maintenance routine:
The Lean Digital Workspace Strategy:
- Tab Management: Utilize browser extensions like OneTab or Workona to suspend inactive browser instances without losing your workflow.
- Hardware Alignment: Ensure your local enterprise software configurations match your machine’s hardware limits. If your daily workflows demand heavy virtualization or data processing, advocate for a minimum hardware baseline of 16GB–32GB of unified memory/RAM.
By implementing these diagnostic methodologies, you can quickly transition from tech-induced frustration to optimal operational continuity, ensuring your digital workspace performs at the same elite level as your business strategy.